Investigating Email: So, How Do Hotmail Users Actually Behave?
01 Apr 2020
This article is written by Guy Hanson who is part of the Email Council and the Research Hub.
In my previous post, I analysed the results from the DMA’s Consumer Email Tracker report, and identified how email address ownership profiles are a real thing, with Hotmail users looking distinctly different to their Gmail counterparts as factors such as age, gender, location and device usage are applied.
In this post, I’ll extend the analysis to identify whether there are also differences in the way address owners engage with their emails. I selected 5 key questions from the report, and we’ll see that again there are real variances – some informed by user profile, and some determined by the functionality and user interfaces offered by the different providers.
Note: The research was conducted in December 2019 via an online survey of 2,051 respondents who were nationally representative of UK adults. Unless referenced, all data in this article is from this survey. Common domains have been grouped together under their parent companies – Hotmail, Outlook.com, Live.com and MSN are combined under Microsoft, while Yahoo and AOL are grouped under Verizon. The “Other” grouping will be mainly BT Internet, Sky, and Virgin Media users.
How often do you check your spam/junk folder?
For email marketers, the learning that over half consumers check their spam/junk folders daily is re-assuring. It means that when legitimate emails generate “false positive” spam treatment, it is likely they will be found and recovered.
However, it is notable that this behaviour is far more prevalent among Microsoft users, posing the question – are their emails more likely to go to the spam folder in the first place?
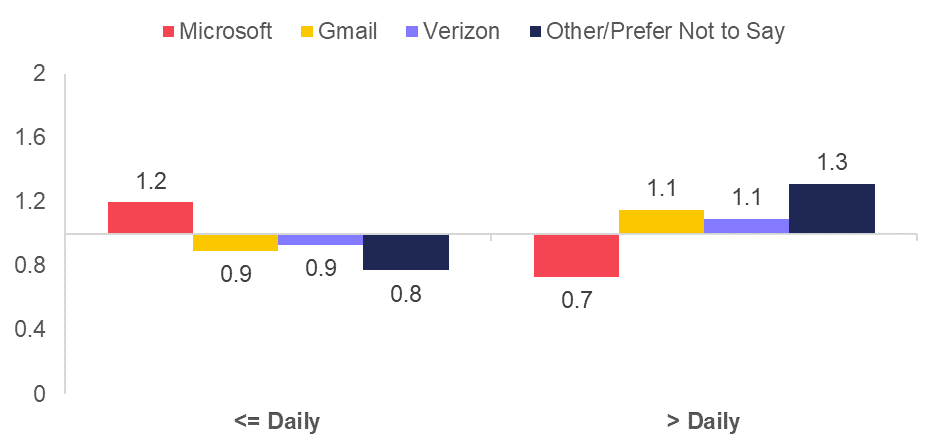
There is evidence to support this, in Return Path’s 2019 Senderscore Benchmark report, inbox placement rates for Microsoft were 9% lower than Gmail for top-tier senders. Gmail also quotes the amount of wanted mail landing in the spam folder at under 0.05%
How many emails do you receive per week?
The standout trend here is that Gmail is the only inbox provider where responses are weighted towards lower volumes, while all the others trend toward higher volumes.
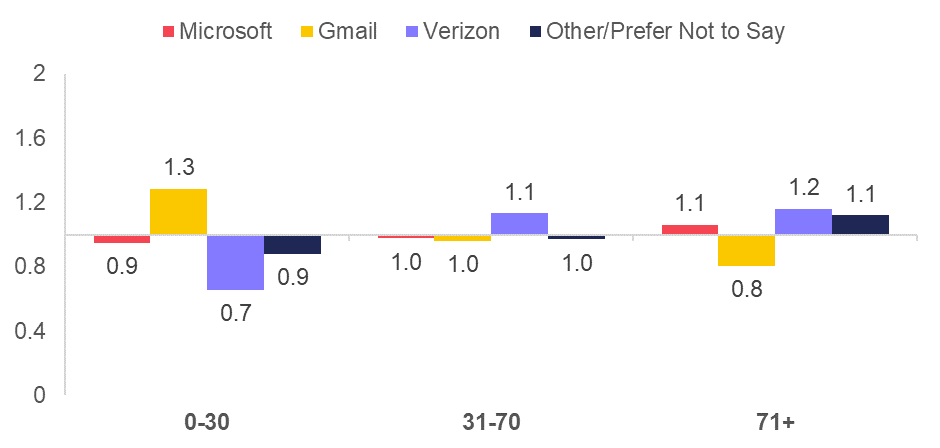
A likely reason is that Gmail is well known for its tough position on email recency. Gmail users are proactively prompted to unsubscribe from programs they haven’t engaged with during the past 30 days. Because of this, many senders apply more aggressive recency criteria to Gmail addresses, suppressing them earlier than other non-responders. This will explain why Gmail respondents report seeing less emails that other inbox users.
What percentage of the emails you receive are useful?
The overall responses to this question provided some tough learnings for email senders. Only 1/6 said more than 50% of the emails they receive are useful.
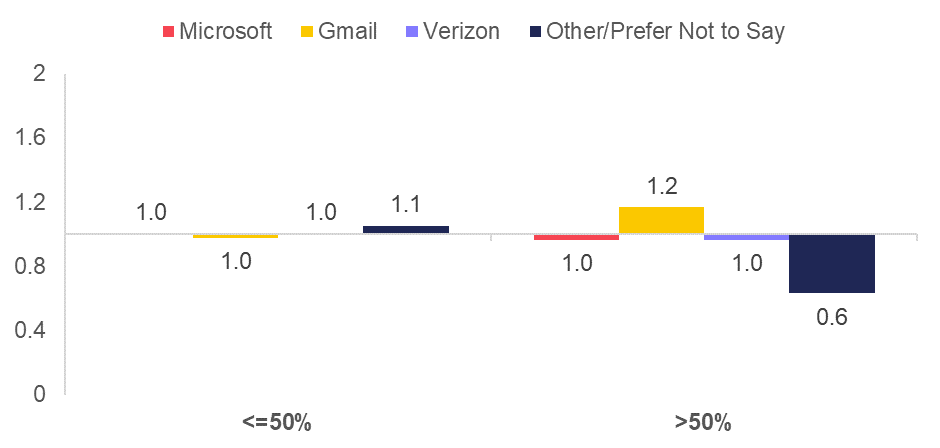
Gmail is the only inbox provider to buck this trend, and the reasons almost certainly map onto the previous point. Suppressing non-responders earlier means what remains is automatically more useful (and relevant) as a result.
How do you stop receiving unwanted emails?
A very encouraging overall response for email marketers is that respondents said they are more than 3X more likely (68% vs 19%) to unsubscribe rather than reporting the emails as spam/junk. This reinforces other commentary we’ve provided on the post-GDPR “halo effect” and the increased levels of trust consumer have around how their personal data is used.
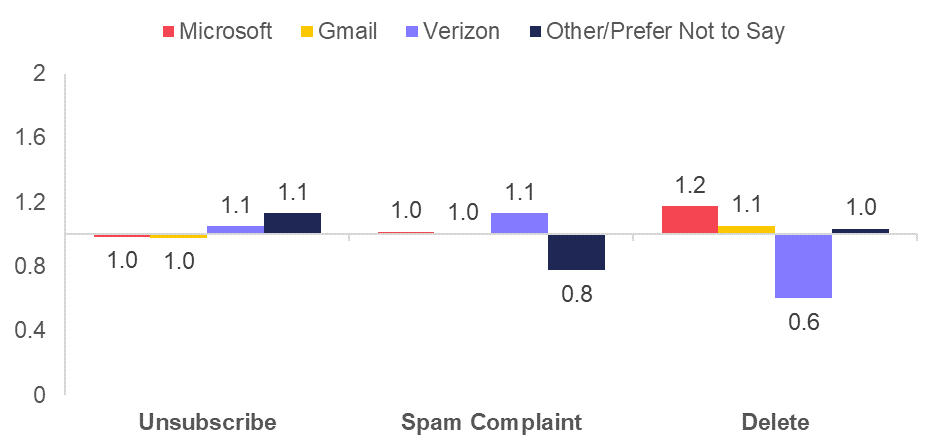
Two notable observations from this data:
- Microsoft respondents are more likely to delete unwanted emails. This may be a side-effect of Outlook.com’s “Sweep” functionality, which allows users to quickly delete unwanted email in their inboxes.
- Gmail users enjoy the ease of being able to create temporary email addresses, and this explain why “Change Address” is so popular with these respondents.
What do you prefer to happen after unsubscribing?
A large majority of respondents (70%) expressed a clear expectation that they would receive no more emails (or transactional emails only) – in line with the expectations set by GDPR. However, there are some stark variations when it comes to additional expectations: taken to a preference centre; taken to an exit survey; or unsubscribing won’t make any difference.
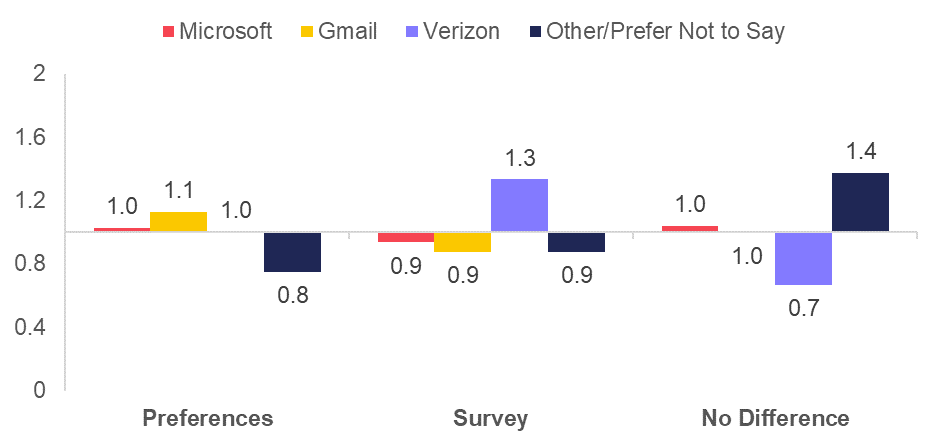
Verizon subscribers are more likely expect a survey. Does their older age profile mean they are more likely to view this as a value transaction, where they must “give” something in return for being removed from the program? It’s also notable that “Other” responders have a far greater expectation that nothing will happen. Is this because non-MAGY providers are less likely to offer list unsubscribe functionality, making it harder to opt-out?
In the DMA’s Marketer Email Tracker research – the latest of which was released 26 March - “Data” is frequently cited as a major challenge for marketers and their email programmes. Lack of data means lack of insight into subscribers, meaning reduced ability to segment to create relevance, which ultimately impacts on program performance and ROI.
I’m not saying that knowing the inbox provider suddenly opens the door to a new dimension of subscriber insights - just because a subscriber owns a “Gmail” address doesn’t automatically infer a distinct set of characteristics. But as I mentioned when I wrote my Admiral Insurance article, there are plausibly a set of underlying factors that drive common behaviours.
While the observations in this article only define subscribers in relatively broad-brush strokes, program owners should absolutely be factoring in the different ways their address owners behave, and construct content and offers to reflect this.
Please login to comment.
Comments