Investigating Email: E-receipts
22 Mar 2021
As part of the ‘Consumer Email Tracker 2020’ report, sponsored by Pure360, we asked people across the UK about various aspects of the channel. This latest analysis of the data provides insights on email receipts (e-receipts). Read on to find out.
E-receipts have been growing trend for many brands to grow their email lists, and one that has accelerated since the GDPR came into force in 2018. It’s increasingly an integral part of any email programme and customer engagement strategy, as such we wanted to investigate the topic further.
To do this, we created two new segmentations using questions that related to consumers preference for e-receipts. These are defined as follows:
-
‘Best served’: The 49% of respondents that selected ‘Email’ and ‘Receipts’ to the question ‘Which of these types of subject would you agree are best served by the following communication methods?’
-
‘Like e-receipts’: The 59% who said they liked email receipts (scoring it above 4 on a 7-point scale) when asked ‘How much do you like or dislike the following in emails you receive from brands?’
The DMA Insight team then re-analysed the data using these two segments to understand where there was significant difference from the average consumer. The results reveal both of these new segmentations to be power users of the channel and marketing they receive through it, but with an opportunity to foster loyalty among these customers too.
Email Behaviour
The ‘Like e-receipts’ group are significantly more likely to check their inbox hourly at the very least (rising to 39% from 35% on average). Meanwhile, the ‘Best served’ group estimates they receive around 9% more messages to their inbox, compared to the average consumer. Both groups are also more likely to be signed up to receive email marketing from brands – 10.9 for ‘Best served’ and 10.5 for ‘Like e-receipts’, compared to an average of 9.9 overall.
When asked about the various stages in the customer journey, the content brands send and which channels they believe are best to receive this via, there is a distinct trend in both segmented groups towards email. Both prefer the channel significantly more than the average customer throughout the customer journey.
However, it’s the ‘Best served’ group that appears to significantly prefer a range of different channels, with email leading the way. The graph shows the averages with the increases for this cohort in bolder colours, along with the percentage where this is a statistically significant difference.
Which of these types of subject would you agree are best served by the following communication methods? (Grouped into pre-/post- purchase and customer service) (Average vs. ‘Best served’)
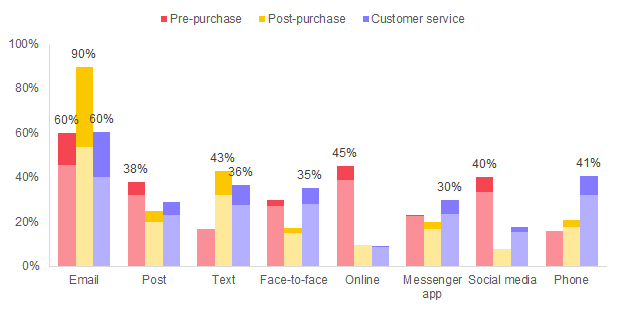
As well as preferring email across the purchase journey, the ‘Best served’ group was more likely to engage with this content too. These customers are more likely to click on a link when they received an interesting discount (43%) and more likely to visit the shop/website on their mobile when they see something they want to buy in an email (41%) – both significantly higher than average (36% and 35% respectively).
Email Preferences
Looking at the preferences and things these two segments like when it comes to email, it only becomes more apparent that both groups are power users. The ‘Best served’ group likes to receive discounts and offers (70%), as well as e-receipts (68%), significantly more than the average consumers (65% and 59% respectively).
Somewhat unsurprisingly, the ‘Like e-receipts’ group say they like all of the email types included in the survey more than the average consumer – this increase was by around 10% for ‘Discounts & offers’, ‘Advanced notice of new products/services & sales’, ‘Competitions’, ‘Access to other benefits’, ‘Product reviews, user guides or other information’, and ‘Advice, articles, information, tips or tutorials’.
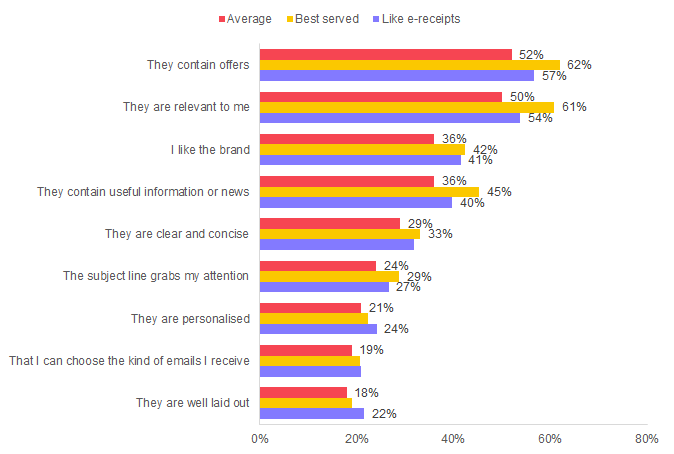
In addition, when asked why they like the emails they receive from brands, while both groups agree with the average customers on the main drivers, these two cohorts appear to feel more strongly about these aspects. For instance, they are significantly more likely to cite offers, relevance, usefulness and liking the brand as key reasons, as well as a number for others (see below).
Now think about the emails you like to receive from brands, which of the following best describes why you like them? (Select all)
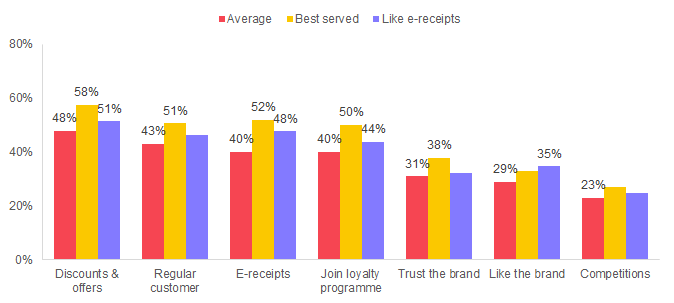
These increased feelings are replicated in the reasons these customers give their email to a brand too. While the overall prioritisation of these drivers is remarkably consistent, both the ‘Best served’ and ‘Like e-receipts’ groups cite many of the top drivers significantly more than average (see below).
What are normally the main reasons you give your email address to a brand? (Select all)
Next Steps
So what does this mean for marketers? What opportunities could e-receipts offer brands to engage consumers? Can they also further secure customer loyalty or are your most loyal customers also the most likely to engage?
The DMA’s Email Council has published their latest advice and thoughts on these findings to answer these questions and many more besides. The article by Saravanan Subburam is available here and the article by Konstantinos Karagkounis is available here.
To find out more about the latest analysis and findings from the DMA’s email research series, visit the research section of the website and to sign-up to attend the events launching the 2021 research, visit our events and upcoming webinars page.


Please login to comment.
Comments