Industry Diversity: Ethnicity and Race
22 Sep 2020

As we saw in our introductory article to this series, diversity in the workplace has been high on many organisations' agendas in recent years. However, often the discussion tends to be dominated by single issues. What about all the other shapes and shades of diversity?
In this article, we analyse what our industry looks like, with a specific focus on ethnicity and race. Our other articles in this series also examine ‘Background and Education’, ‘Disability and Health’, and ‘Gender and Sexuality’. All of these explore the relevant aspects needed to be considered and understood, so we can move beyond mere demographics and focus on creating more inclusive environments.
Ethnicity
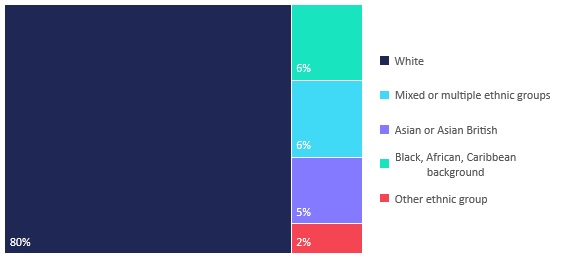
Most respondents (88%) identify themselves as White (with 66% indicating their ethnicity as British, English, Northern Irish, Scottish, or Welsh). 6% have a Black, African, Caribbean background. 6% selected mixed or multiple ethnic groups. And 5% identify themselves as Asian or Asian British.
Which of these ethnicities do you most identify with?

According to the 2011 Census, among the total population of England and Wales, 86% was White. People from Asian ethnic groups made up the second-largest percentage of the population (at 7%), followed by Black ethnic groups (at 3%), mixed/multiple ethnic groups (at 2%), and other ethnic groups (at 1%).
Moreover, the 2011 Census showed that almost half (46%) of the foreign-born population identified with a White ethnic group, a third identified as Asian/Asian British (33%), and 13% identified with Black/African/Caribbean/Black British.
Between January and March 2020, data from the ONS on the labour market by ethnic group reported a total of 76.6% employment rate for people aged 16-64, with a 78% rate for White people and 68.2% for minority groups.
McKinsey’s data shows that ethnically diverse representation in UK executive teams increased by an average of 6% since 2014. When considering ethnic-minority representation in the broader population (13%), British executive teams seem closer to achieving a “fair share” (with 7% on executive teams and 11% on board of directors).
However, this data masks sensitive variations within UK companies, as a large proportion of businesses still have no ethnic minorities on their executive teams (or boards), and a very reduced group of organisations have international executive teams specifically.
Take the Next Step
To gain real diversity in the workplace, organisations must dig deeper than simple metrics like quotas. Now that you have seen the data, what are the actions you can take? Find out what the DMA is doing to make a more diverse and inclusive future a reality for our industry:


Please login to comment.
Comments