Analyzing AdWords With Analytics Treemaps
28 Jan 2015

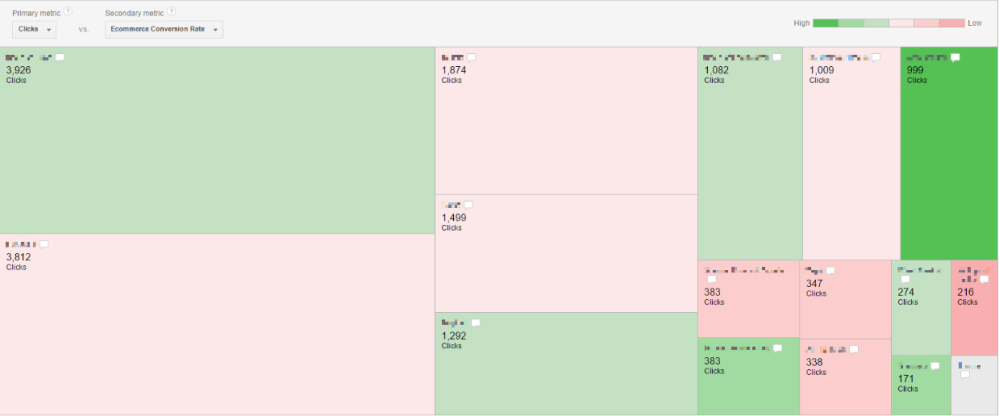
Let’s cover off how the reports work in comparing two metrics. Our volume metrics such as impressions and cost are represented by the rectangles surface area. These are called the primary metrics. The red to green color scale summarizes the secondary metrics, relative to the primary metrics. Like a traffic light, deep green shows good performance and dark red represents poor performing areas.
The report works on a breadcrumb structure. You can click into any rectangle to go down a layer from campaign to ad group to keyword.
The below quadrant gives an idea of which rectangles we should focus on.
Large green box - is an area of your account that is doing well and bringing you strong results. Is there more we can do here to push traffic? Can you apply what is working well here to poorer performing areas?
Small green box - shows us an area that is doing well but low volume. Is there anything you can do with keyword expansion or ad copy to help drive more traffic here?
Large red box - are areas of your account that need investigating. You are driving lots of traffic here but the users aren’t finding what they expected which is wasting budget. Reassess the keywords ad copy and landing page and try and create a better overall journey.
Small red box - This is low traffic and low conversion rate. Monitor these, but working on your high-volume areas first is likely to drive a better return faster.
Clicks and conversion rate is just one example of what we can use and there are a multitude of primary and secondary metrics you can compare. Here are a few other examples to try to help spot which areas of your account to focus on first:
1. Impressions and CTR
2. Cost and ROAS
3. Clicks and % New Sessions
4. New Users and Bounce Rate
Overall Opinion
The visualization of data in the Treemaps report offers intuitive insight into which areas of our accounts to focus on first. They take a relatively short time to put together and the breadcrumb structure helps drill down from the top-level campaigns of an account to the keyword pipeworks.
To view the article as originally displayed on the Search Engine Watch website, please click here.


Please login to comment.
Comments