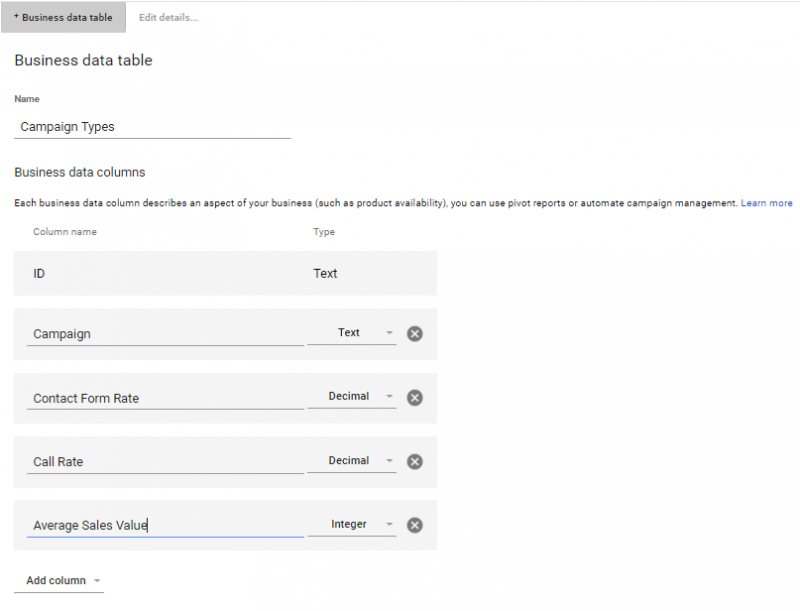
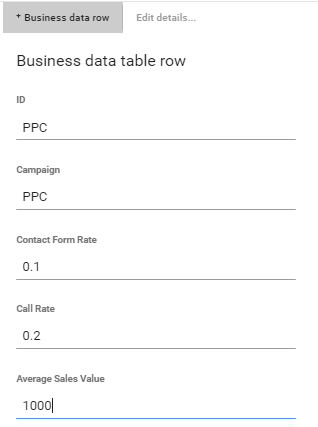
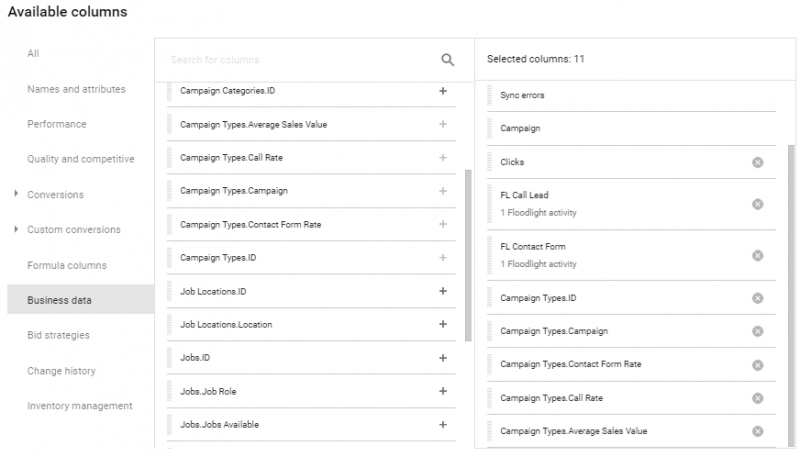
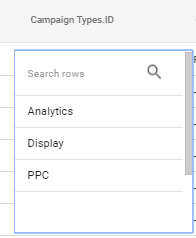
Data Studio 101: How to Get Real-Time Reports in Data Studio
08 Feb 2017

Dashboards are only useful if they are visible and easy to access. Consequently, many clients display theirs on communal monitors or projectors and need their data to update in real time. Google Data Studio is a fantastic data visualisation tool but treats some connection types (e.g. Google Sheets) as static data. Data Studio reports that include these connection types currently require a user to manually refresh the data within a dashboard in order to display the most up to date information. This is somewhat of a problem when it comes to communal displays. Let’s face it, nobody wants to be the person manually clicking refresh every minute!
This blog details how our Analytics Quality Assurance (QA) team came up with an innovative solution to the problem using a free tool called Jenkins and the Auto Refresh Chrome browser extension.
A Closer Look at the Problem
The first key point to understand is how Data Studio accesses and stores the data used to generate its reports. Essentially, Data Studio pulls the information from ‘connections’ and holds this data in temporary storage (we’ll refer to this as cached data) which is then used to populate the dashboard widgets:
The second key point to understand is that Data Studio processes the connection differently dependent on the type.
The final point to understand is which user actions are linked with the automatic and manual updates detailed above. The browser refresh button effectively re-opens a report i.e. it therefore only automatically updates the cached data for “auto” data sources.
Amending the date range within a report also automatically updates the cached data for “auto” data sources only.
In order to update the cached data for “static” data sources, the refresh button within Google Data Studio itself must be used (or the connection can be edited, essentially reconnecting the data source):
Without this manual refresh, the information displayed within the report widgets would still be the data available at the point the connection was originally configured/the last time the button above was pressed. Critically, for our purposes, a manual data refresh updates the cached data at a global level and makes it available to all report users.
The following table summarises how different user actions update the data displayed for the different data types:

This means that refreshing the page or even the use of control and date range filters doesn’t refresh the data for static source types.
So if we are in need of a real-time or updating report that includes a Google Sheet as a data source, we’re stuck! The only options available to refresh the data are the Data Studio refresh data button, which is tedious.
Introducing Automation Tools
Automation tools are a key part of the QA professional’s armoury. They enable the tester to map, then complete an online journey, without the need to manually complete the journey themselves. This enables testing at scale and with cross-browser capabilities built-in to boot.
There are many automation tools available; the following provides a quick summary of the tools used for this process.
Jenkins
Jenkins is an open source Continuous Integration Server (CIS) that can run automation tests written in several different languages. It supports a wide range of plugins and features that help QA professionals to build and run their tests, including the ability to schedule tests using a simple Cron syntax.
For newbies to Cron, the following diagram should help you to understand the syntax:
For example, if you want the project to run each minute during business hours on week days, the syntax would be:
* 9-16 * * 1-5 *
Maven
Maven is an open source project management tool for Integrated Development Environments (IDEs). As part of the Jenkins configuration, a Maven dependency can be selected which provides a project template structure for the IDE of choice (we used IntelliJ IDEA). This enables projects, reports and documents to be managed using a Project Object Model (POM). The customization of the project can be done by installing the Cucumber plugin in your IDE.
Selenium
Selenium is an open source automation framework. It automates the browser actions with Selenese commands. Selenium supports scripts written in 7 different languages (including Ruby, Python and C#, Perl and JavaScript) and we used Java for our solution.
GitHub
GitHub is a code hosting platform for version control and collaboration. This enables team members to work together on a project from anywhere. You create a repository from which branches can be started to manage/pull/push the recent/old commits of your code. You can also merge the code with another version of the code that is pushed by another user. Simple command line arguments help to achieve the version control on your project.
Building our Solution
Our solution will be based across two machines:
- A display screen machine
- A secondary machine running the Jenkins server and automation scripts
To create our automation, we first have to map the virtual user journey. The journey to click the refresh button and update the dashboard data can be broken down as follows:
- Login to Data Studio
- Navigate to & open the report
- Click on refresh data button
This flow is then translated into code using Selenium/Java and tested locally to confirm whether it is running successfully or not.
The script can be viewed by clicking here.
Now that we have our code we have to tell it when to run. We initially ran the automation script on an infinite 1-minute loop which worked okay but wasn’t very efficient. This is where Jenkins came to our assistance. The Cron-based scheduling feature allowed us to run our updates within business hours only.
Say Hello to Jenkins
By working with Maven and GitHub we have 2 different ways to let Jenkins know which tests to run:
Option 1: The local system path of the POM.xml file for the project (which includes the test runner dependencies) can be fed directly to Jenkins.
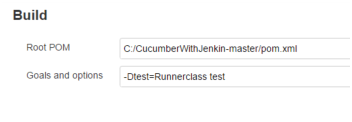
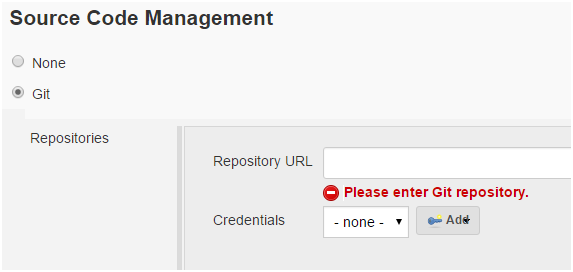
Option 2: Alternatively, with the project in GitHub you can simply provide the GitHub repository URL to Jenkins. Jenkins automatically searches for POM.xml from the GitHub project and executes the tests.
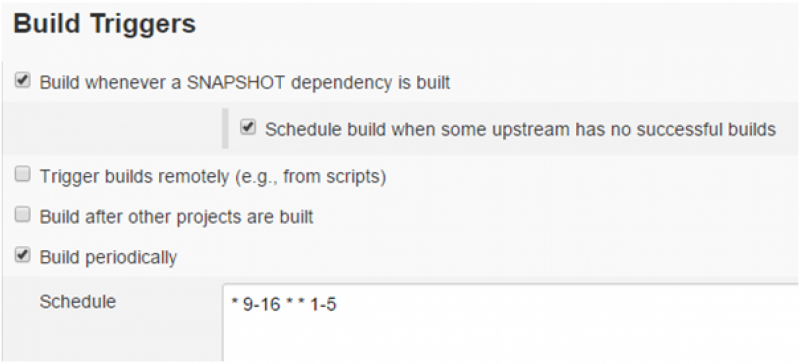
This is how the Cron job can be scheduled in Jenkins. This particular example says the job should run every minute from 9am-4pm on weekdays.
Once everything is set up, you can find the Jenkins build and its time stamps within the project overview screen:
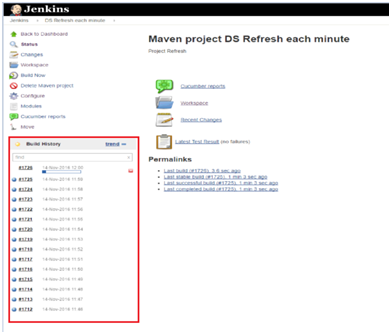
As you can see from the red rectangular box, the project is running each minute.
Adding the Auto Refresh Extension
Since the automation is not running on the display machine, we need a way in which to sync the data displayed on that screen with the most recent refresh generated by the automation. This is something that can be handled by an extension within the Chrome browser. There are several available, but we like the Auto Refresh extension which enables us to automate page refreshes at set regular intervals (from seconds to hours). We recommend to set the interval to update at the 40 seconds rate, as our automation script runs each minute.
The End Result
A multi-client configuration, with Jenkins running remotely from a display computer running Chrome and the Auto Refresh extension, enables Data Studio to become a fully automated dashboard solution that is ready for prime-time communal viewing. Note that whilst we ran our tests on the free, locally hosted version of Jenkins, it would be possible to run this via a Cloud-based hosting solution if you have that available.
To read this blog written by Dan Jennings, Priya Lankalapalli and Jeff Lukey on the Periscopix website, please click here.

Please login to comment.
Comments