Big Data, Little Information
27 Feb 2017

I am going to start this article by referring to a BBC documentary on the Royal Blackburn Hospital. It showed a week in the life of A & E, including Saturday night where 95 patients were trying to access 33 cubicles and beds, where corridors were full of people, where the waiting time got to nearly 14 hours (over half a day, and these are ‘accidents and emergencies’, remember), and where even the paramedics were queueing up to get in. Well, this hospital’s A & E is rated ‘good’ - how can that possibly be? Welcome to the alternative world view of data.
I think that rating is down to the measurability of lots of little things that somehow add up to a whole. It’s about death rates, number of staff on duty, reduction in sickness and absence, a whole range of minor (but important) things that added together create ‘GOOD’. We all know in human terms there is a degree of nonsense here, but this is the world of data-driven reality.
Here’s another example. Why did all the polls say Clinton was going to beat Trump? Because the big numbers said so, and the Democrats were wedded to their political models. Again, it’s a data –driven reality. Two ‘human reality‘ facts stand out for me amidst all the post-mortems. Firstly, it’s clear that some people lied about their intention to vote for Trump because they were ashamed of what their peers might think (happened with Brexit too). So, the data is (whisper it softly) unreliable. Secondly the whole of the election came down to maybe five counties in two states - maybe as little as a couple of thousand people in an electorate of 128 million - what a failure for data. Some door knocking and phoning might have saved the day for Hilary.
These two examples illustrate two of the fundamental flaws. Firstly, that you are often measuring the wrong thing, and secondly that the data itself isn’t reliable, it doesn’t mean what you think it does.
So, why is this in an article about telemarketing?
Having been in this business on and off for 20 years, I have been battling dumb data for most of that time before it got muscles and started calling itself big data.
So what is data in the context of what a lot of marketers and salespeople use it for?
Here’s my definition: It consists of mechanised actions that are taken as an indicator of human behaviour
-Someone opens an email - the indicator is that they read it.
-Someone clicks through to content - the indicator is they are interested in it, and that they have read it to the end.
-Someone has opened your tweet - the assumption is they are engaged with the 140 characters you have created.
-Someone retweets it - they are positively enthusiastic.
I am not convinced that any of these except the last one can be taken as a reliable guide to behaviour, but those are the assumptions on which we work.
Am I being unreasonable? The laws of marketing probability (from the Big Bumper book of Wishful Thinking) say that enough people taking these actions make the action significant, but that suggests a uniformity that isn’t there. The email heading that says FREE OFFER or this will CHANGE YOUR LIFE may get more opens, but these are followed by immediate disappointment - all communications are not created equal.
It is important to question what is at the root of every interaction, to be skeptical and curious, and here’s an example from my own life, and maybe yours too:
Years ago, I first took one of those personality tests that identifies a number of broad characteristics - dominant, persuasive, analytical, or friendly, with appropriate traits. Having undertaken tests, everybody accepted the findings and the way they were produced at face value but I was curious as to how had they built and validated the model. It turned out they had tested it on several thousand young Californian students - a very particular age group, within a very particular set of cultural norms – so, does that invalidate it? Probably not, but it does colour the way we may look at and trust the results.
Correlation and Causality
There is one other basic faux-logical assumption that gets in the way of understanding Big Data and that is the difference between two closely related but different things - correlation and causality.
Correlation is a mutual dependence between two sets of variables. I have given that very formal mathematical/statistical definition because too often the distinction is not understood, or it is mistaken for causality.
Causality is where there are two processes or variables, where the first is understood to be partly responsible for the second, and the second is dependent on the first.
Let’s make this plainer:
A correlation will show that areas of economic deprivation have a higher level of crime.
Causality will seek to prove that the first directly influences the second - the burden of proof is much higher, if you like.
Translating this into the world of big data, you might get an example like this…
“Margarine consumption linked to divorce."
If you saw that headline on a newspaper or website, what would you think?
What if you read a little further and found a compelling graph showing the rates of divorce and margarine consumption tracking each other closely over almost 10 years.
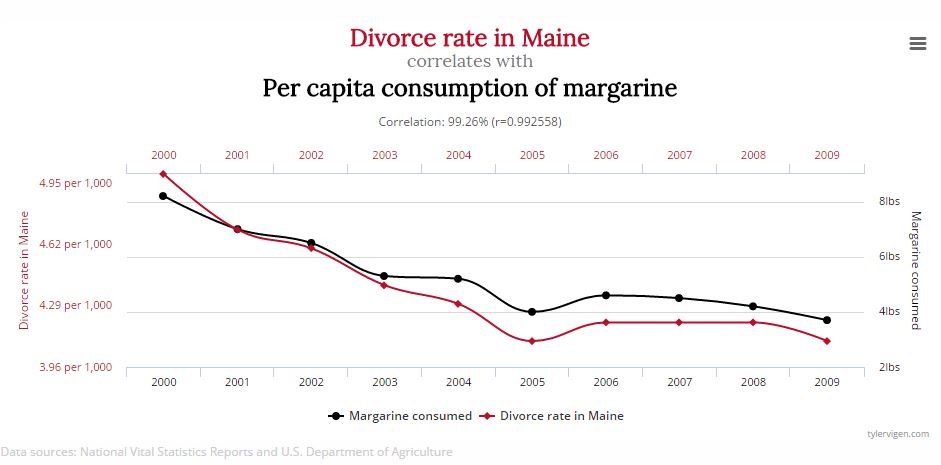
This comes from a Harvard website called spurious correlations
http://www.tylervigen.com/spurious-correlations
It includes other gems such as the fact that total imports of Japanese cars into the USA over a 10 year period correlates closely with number of suicides by crashing motor vehicles.
OK, these examples seem patently absurd but the lines start to become blurred very quickly when you look at data that drives sales and marketing interactions with customers and make lazy assumptions about correlation equaling causality, without any need for the ‘higher burden of proof’.
THE HUMAN WAY
So how does this work when a human being is first collecting and then assessing the information (I am not calling it data for a good reason, keep reading…)
There is a sense of the emotional engagement in the call - at its simplest, we are assessing if someone is happy, annoyed, uninterested, even lying in some cases. It’s strongest in a face to face encounter, but also works to a reasonable extent on the phone - my area of expertise.
We will collect ‘comment’ (free text is the jargon). For me, it’s the most valuable part of the call, but it’s often ignored, too much information, too much work to read and assess it.
Which leads to the second problem. Even if we collect and comment on the person’s emotional state, and the things they actually say, are marketers prepared to do the ‘hard yards’ of reading it and assessing it as part of their decision making process?
There is an even more fundamental problem than this. In a previous life, I ran a number of customer and consumer care lines, working with many major and much loved brands under the umbrella of companies like Mars, Britvic, Dairy Crest , GSK, Kelloggs, General Mills - think Mars Bars, Galaxy, Bounty, Topic, Twix, Pedigree Petfoods, Whiskas, Pal, Uncle Ben's Rice, Cornflakes, Rice Krispies, Pepsi, Robinsons, Tango, Britvic juices, Cathedral City, Utterly Butterly, Old El Paso, Betty Crocker, Haagen Daaz, and car brands such as Mercedes and Honda, where emotional engagement again runs high.
It’s a long list, and I am listing it out because I got a real insight into peoples’ emotional engagement with these brands, by listening to calls. I wanted to try and unite much of the comment and emotional engagement that we got from unscripted interactions with these customers, typically strong brand advocates (or they wouldn’t be bothering to call). I created a system for capturing this information called the 4C’s which helped to catalogue the information into four categories to make it easier to assess and more useful to the business, particularly (I thought) to marketing.
But, by and large, with honourable exceptions, the marketers were not interested, but more fundamentally, there was nowhere to store this information. It wasn’t ‘Data’, so it didn’t figure. It was raw, unfettered, untainted customer feedback, but it couldn’t be put anywhere. If it is not Data, it doesn’t exist.
SUMMARY
Here are some tips for applying the ‘human‘ factor to Big (and any) Data…
Skepticism: take a long look at how the data has been complied, what assumptions have been made.
Human action: try and assess what the actual human action was behind the click, the response, the ‘open’
Data validation: ask if the answers are honest and if the questions are themselves manipulative. ‘How much do you like our fruit juice?’ is a different question from ‘Do you like our fruit juice?’
The whole story: try and look at the whole data set and the bigger picture. I can’t resist giving a couple of examples here. I worked with a client once who, looking at sales figures from our telemarketing told us,
“See, 15% of people who recalled our email went on to buy…”
“But” we replied,
“12% bought who didn’t open the email at all, and 2% from people where the email had bounced back…”
And here’s a favourite example from a famous film (and incidentally a clever book) Jurassic Park, where the mathematician Ian Malcolm asks about counting the dinosaurs. They can’t breed, so the scientists know there is 336 and that is where their counter stops. Malcolm says, “leave the counter on”, and when they do, it goes way past 336. The dinosaurs had found a way to breed, but that simply wasn’t taken into account…
Correlation and Causality: don’t mistake 2 things that move together to be causally related even of it looks obvious - seek the higher burden of proof.
Finally. I am working with a client currently to provide an analysis of a customer survey. There will probably be 800 surveys. There will be DATA in the form of answers with scores and YES/NO choices, counted, batched and cross referenced with other data. But, I am committed to reading all of the free text within those surveys, to find out what people actually said, talking to our call agents to get an emotional ‘barometer’ reading, and listening to a good sample of calls to hear the conversations emotional tone for myself.
I am going to provide INFORMATION in the form of a written report, backed up by DATA. The client will then EXPLAIN it to her management and they will agree ACTION based on that explanation but the information - the ‘human’ part of the survey, how their customers actually feel, what they have actually said - will be the starting point.
By the way, Information, Data, Explanation, and Action spells IDEA and maybe that’s what we have here...


1.png)
Please login to comment.
Comments