How to discover content that works for your audience using principles of data science
10 Nov 2017

A lot (if not most) of digital marketing is based around content. Whether it's text, video, images, audio, experiences or different types of research papers - all content should be made specifically for your audience.
This is a methodology to find out what the best content for your audience is using the latest resources and technology including data science processes made simple (in Excel) and somewhat advanced tracking and analytics.
Find out what interests your existing audience has
You can use Google Analytics' Affinity Categories (in this article this is shortened to AC) to obtain this by combining them with In-Market Segments (in this article this is shortened to IMS).
We will try to segment data using an emulation of a principle of data science called "Clustering". This is basically segmentation based on what a machine learning algorithm determines are the most important factors.
Clustering is easily performed manually(ish) as well (if you don't have a big data capabilities) by using Excel and a word-cloud (to make it look great in reports).
In Analytics:
Go to Interests > In-Market Segment and add AC as a secondary dimension, make sure you have your total goal value as a column.
Select Goal Conversion Rate as a Sort By then Select Sort Type as Weighted.
Make sure that Show Rows is set to 500 then export this spreadsheet.
In Excel:
You need to consider the amount of users you have that participate in each affinity category as well as the revenue generated from it and apply a weighing formula to this to determine the most important AC.
You can use something like:
Goal Value / Number of Users = Weighting (Money Made Per User)
This is used to determine the AC with the users that make you the most money.
Filter out the ones that have a low number of users to make sure that you don't consider a segment that had 3 people in it as the most relevant. The weighting will consider the most money per user, regardless of the number of users - so this is necessary to maintain the quality of data. Also make sure you don't go too high - you should have about 200 results.
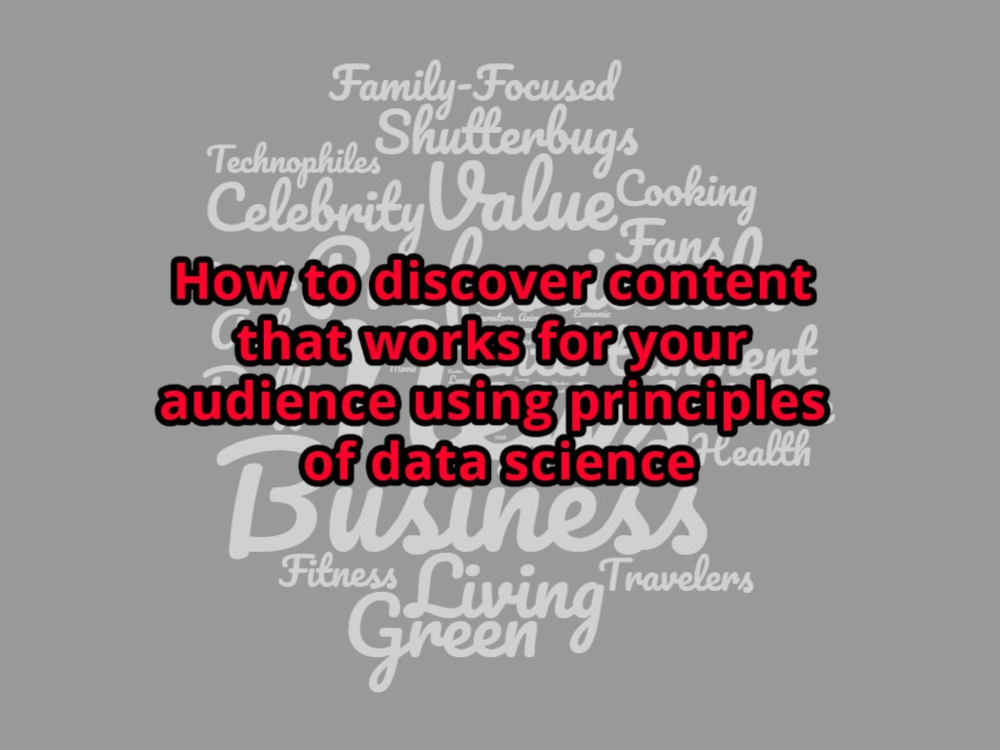
You can make 2 word clouds now - the IMS values and the AC values that are useful to find out how your users are segmented and what they are interested in.
The point of this word-cloud is to easily display the most important ones.
When you do this - you will notice that certain words are displayed really big as they are classified as most important because they come up the most in your text.
You will also notice that these words are most likely useless - words like Enthusiasts or Shoppers as they are present in almost every type of AC in Google Analytics.
Make sure you go back to your data in Excel and run a Find & Replace to replace these words with a SPACE. If you notice words combined - like Travel/Leisure make sure you run another Find & Replace to remove symbols like "/" and replace them with space. After this cleansing process - re-paste the data in the word cloud.
You should now have something like the image below - and you should be able to clearly see what your audience is really interested in.

Next Steps
I would highly recommend getting a lot better segmentation and analytics tools before doing this on a bigger scale as the "personas" that these kinds of software build are a lot better than what you can get from Analytics.
This, however depends on your budget and type of business.
Hope this helps,
Narcis
https://www.linkedin.com/in/narcisradoi/


Please login to comment.
Comments