Are you profitably reactivating your dormant customers?
13 May 2021
Every marketer knows intuitively how incredibly valuable their customer base is, but you need to be able to accurately quantify that, and then be able to cost effectively cultivate it.
Earlier this year, Gartner stated that 73% of chief marketing officers (CMOs) report they will rely on existing customers to fuel growth in 2021. Some of this relates to the uncertainty that came with 2020 and some from the knowledge that it costs 5x more to acquire new customers than to reactivate existing ones.
Connecting with customers, and delivering value both now and in the future, has never been more important.
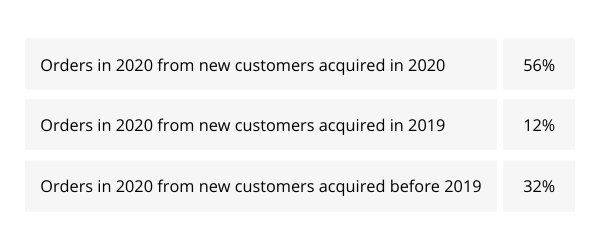
Looking across a range of different years, and several different D2C retailers, we have been able to calculate some averages for where sales/orders are coming from, in terms of when customers were acquired.
In 2020, just over 50% of all orders came from new customers, which means that nearly half of all orders came from existing ones.
A useful fact about existing customers is that we can predict with reasonable accuracy when they are going to order, and hence provide the stock and the warehouse capabilities to deal with that.
Below are some averages for orders made by existing customers.

What was striking was that for each retailer we examined, the % of orders from existing customers within each month was very consistent across several years, as well as there being a similar pattern of an increase in demand from new customers in the pre-Christmas period.
So how do you most effectively reactivate your existing customers?
We propose three clear steps which include building a reactivation propensity model, developing merchandise category propensity models, and getting the timing of communications right.
1 Start by building a reactivation propensity model
Most retailers have a much larger number of what are often unfairly described as ‘dormant’ customers, than they do of ‘active’ customers. But it requires considerable marketing spend to communicate with all of them, outside of owned channels such as email, particularly when using direct mail methods for catalogues/brochures and paid digital.
The trick is to be able to differentiate ‘dormant’ customers, who have a higher probability of reactivation, from those with a lower i.e. knowing who is most likely to purchase.
This is where a reactivation propensity model becomes essential.
Here is an example of a reactivation model, developed for a retail client who had over half a million customers who had not ordered in the previous two years, and for whom they had consent to mail.
We developed the model by taking as the target variable customers in this group who had subsequently self-reactivated, without receiving any catalogues or other communications from the client. The area between the blue line and the black expresses the uplift generated by the model.
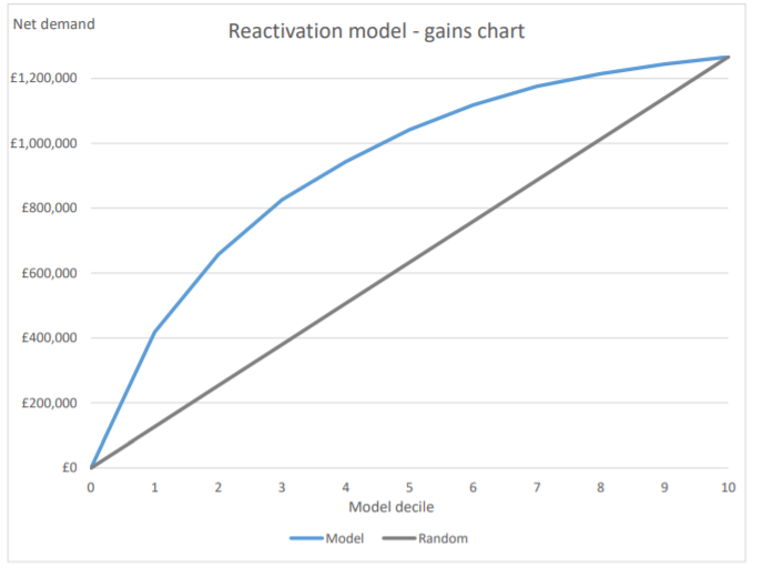
To express this another way, the first decile 1 on the left had a demand per customer of 330% compared to the average for the group, and the bottom decile 10 on the right had a demand of 17% compared to the average for the group. So, the best decile was almost 20x more likely to reactivate than the worst.
The variables that went into the model were all derived from transactions made by customers in that group, including both the value of orders and the merchandise categories within which they were ordering.
The client went on to use this model to select customers that could be reactivated affordably.
2 Understanding what types of merchandise individual customers are more like to buy
How do I know what products my customers are most likely to buy next? There are a number of different ways in which this question can be approached.
- The simplest is just to offer them more of what they last ordered. However, there are many reasons why this may be the wrong approach, of which the most obvious is that if they have already stocked up on something that may not need any more of it. Also basing a prediction on a single purchase means ignoring all the other information we hold on the customer.
- Look at what customers who bought product X most frequently buy next. This approach works well if you have a limited number of products, but, if you are selling hundreds of different product types, you are going to require the same number of different creative contents to illustrate what you are offering. And in addition, the complexity of dividing a customer base into hundreds of segments would be overwhelming.
- Our preferred approach is to develop merchandise category propensity models so that each customer can be scored with a prediction of what they are going to spend in each category in say the next season.
By working at the category level, rather than the product level, we remove a lot of complexity and also allow for a range of content to be presented to the customer.
This is an example of indexed category spend predictions for a handful of customers. In other words, as the overall average for all categories was 100, how much more or less likely is an individual customer likely to buy in each category:
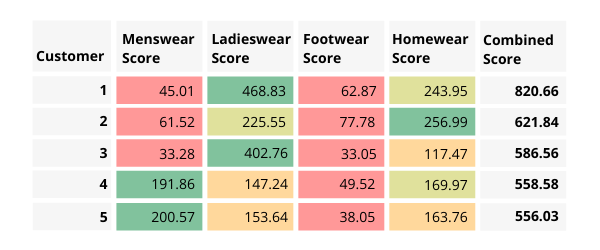
The green cells represent the category for which each customer has the highest score. Clearly this should become the priority category to offer each customer for reactivation, but often their second score is high too, so this provides the opportunity to flip flop between the top and the second category. In this example footwear gets a low score throughout, so the plan could then be to combine footwear into the ladies and menswear content.
3 Getting the promotional timing right
We have seen how at a cohort level how it is possible to understand the overall orders from customers, but the average will not translate into a prediction for the individual customer.
So how do I know when to communicate to my customers with the right offer?
There are a number of different ways in which this question can be approached.
- Calculate when each customer has met their expected purchase level in a period, and then scale back communications after that on the grounds that the ROI from further communications is going to be diminished. This approach can also be used in reverse to step up the level of communications when expected demand levels from individual customers have not been met. This approach relies on a demand in season, or equivalent period, model, so that actual purchases can be compared with expected at an individual customer level. A great attraction of this kind of analysis is that you can run it on historic data and perform what ifs to see where contact density could have been profitably increased or lowered.
- Search for customers who make regular purchases, like annual spends on clothing, or more regular purchases of other types of commodity, and to pitch the communications in the period just before their expected purchase data.
- Set up triggers for customers who show evidence of churning. These will be customers whose demand suddenly drops away. Detecting these triggers is a key part of the toolkit for managing existing customers, and can be used to make very personalised and appealing offers to get the customer back on board.
Conclusion
Developing and using techniques like these to reactivate customers is essential if you are to profitably find and extract value from the more dormant areas of your customer base.
It does require a well-organised customer data platform or equivalent technology, and skilled data science to develop the models.
For any marketer with a substantial dormant customer base, using these techniques will bring considerable gains.
This article was written by Julian Berry at UniFida.




Please login to comment.
Comments