Let's Get Down to Business (Data) With DoubleClick Search
09 Feb 2017

Bringing together your online activity with your wider business strategy can be difficult for Search marketers. Fortunately, DoubleClick’s Business Data feature allows you to incorporate your broad business information with your paid activity for reporting, optimisation and account automation.
What is Business Data?
Business data is effectively an advanced labelling system in DoubleClick Search (DS) that allows you to apply key business information to your Paid Search metrics. It lets you report on, and optimise towards, the data that is most relevant to achieving your wider business goals.
Why Business Data?
Take for instance an online marketing agency who are advertising the various different services they provide. Within our standard reports we can see all of our usual metrics, including all of our lead types. However, as a business we know that leads for different services vary in their likelihood to convert to sales down the line, and that each different service varies in value. Ultimately, we want to be optimising towards data that doesn’t simply make our conversion metrics look rosy, but is having a tangible effect on the profitability of the business. DoubleClick’s Business Data allows us this extra level of insight.
Step 1 - Create Your Table
Firstly, you need to add your business data to the account in the form of a business data table. Navigate to the ‘Business Data Tab’ and select ‘+Business Data Table’. You will then be able to enter a name and define the business data columns:
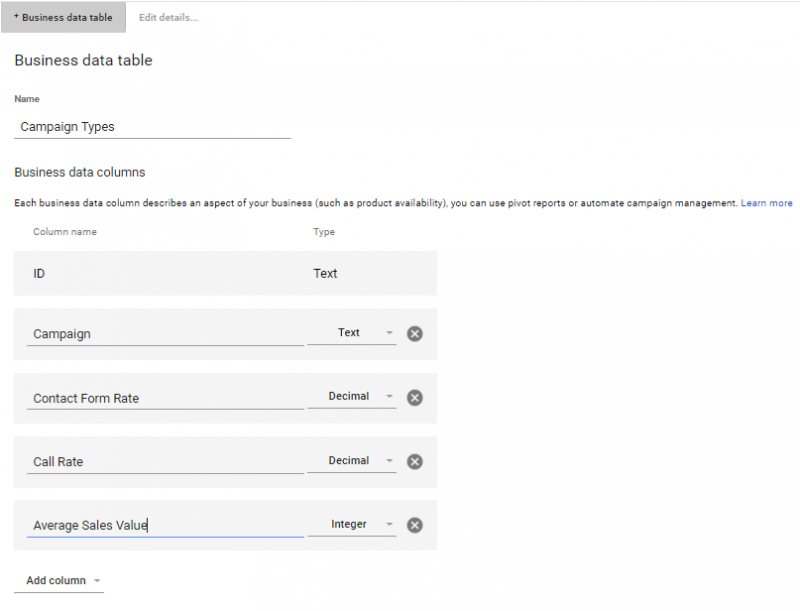
Your columns can be one of three types – text, decimal or integer:
- Text – will typically be the name of the attribute you want to apply the business data to. In the example above we will have the campaign categories.
- Decimal – a decimal that needs to be defined. Usually, this will be some sort of conversion rate. In this example, we have defined two separate decimals – the conversion rate between submitting a contact form and a sale, and the conversion rate between a phone call and a sale.
- Integer – a whole number. In this case, we will input the average sales value for each type of service, to give us a good estimate of the total value of the sale our campaigns are driving.
Step 2 – Input Your Rows
Once the shell of your table has been created, it’s time to add the rows that will contain your data. Go into your table and select ‘+ Business Data Row’ and input the data into the columns you created:
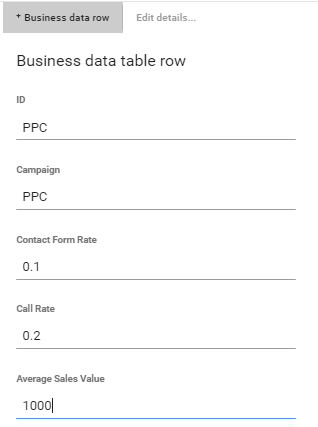
N.B. The ‘ID’ is what matches your business data to the entities in the account you wish to apply it to. This row will be applied to any ‘PPC’ campaigns, so both the ‘ID’ and ‘Campaign’ field will remain as ‘PPC.’
For this particular row we are saying that the conversion rate between a form submission and sale is 10%, between a call and a sale is 20%, and the average value for overall sales is £1000 for PPC sales.
Step 3 – Map Business Data To Your Search Activity
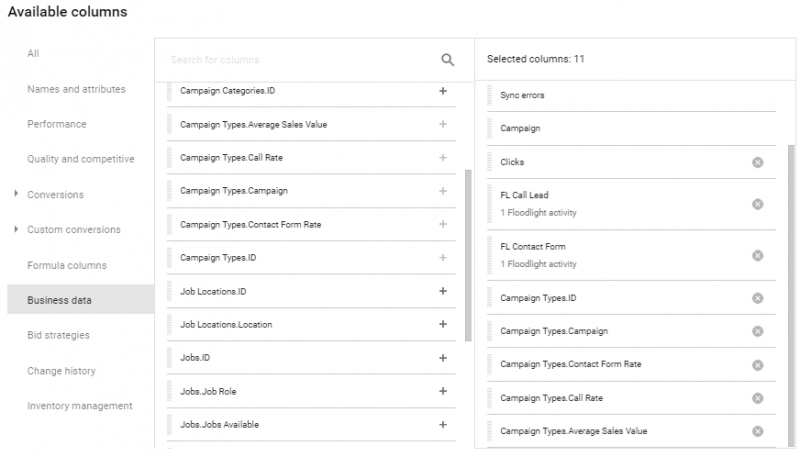
In the DS interface, navigate to the campaigns, ad groups or keywords you want to apply your business data to. In ‘columns’ select the relevant business data columns that you want to view and click ‘apply’:
Next, click on the dropdown arrow in the ‘Campaign Types.ID’ column, and select the ID you want to apply to your campaigns:
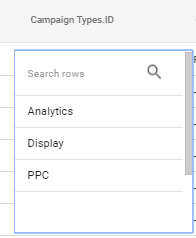
When you have selected this, all of your other columns will auto-populate with the business data you have in your table. As with bid strategies, child entities will inherit the business data applied to a tier above unless otherwise defined:

Step 4 – Use Formula Columns For Greater Insight
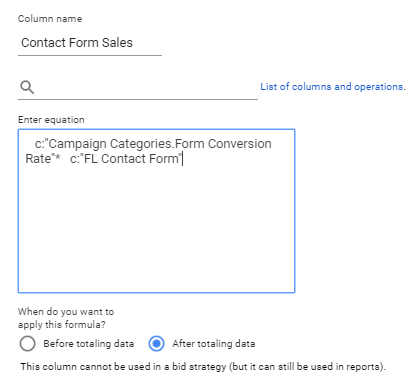
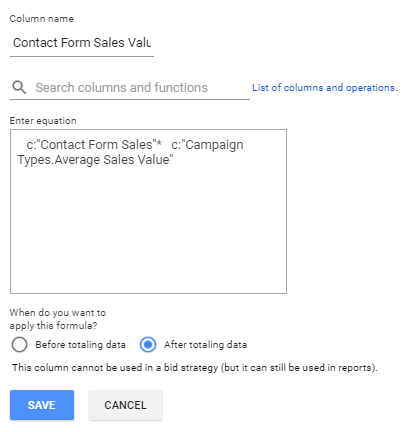
Now the data is mapped to the relevant campaigns, you can use formula columns combining your existing metrics with business data to give you the business insights you require. Using the data we have inputted, we can create a column that multiplies the number of contact forms we have received by the business data conversion rates and average sales value.
Using the above example, let’s say that we track phone calls and contact forms as lead enquiries. We can create formula columns that multiply the number of contact forms received with the contact form conversion rate to work out estimated sales and the number of sales by the average sales value to find out total revenue:
We can use all of our business data to manipulate all of our current conversion metrics in this manner, and leave us with a reporting view that looks like this:
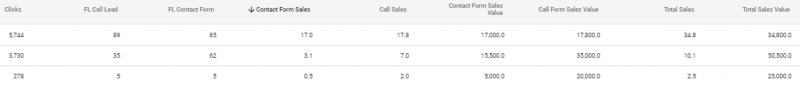
Rather than simply viewing a ‘+1’ conversion metric, we are now applying relevant data to our search marketing for more relevant reporting and optimisation.
Conclusion
Being able to report factoring in your own relevant business information is something that has previously only been achievable through offline reporting and manipulation of search data. Not only does DS allow us to surface this level of insight in an easily usable interface, crucially it allows us to directly use this data to inform and optimise our search activity, rather than simply report on it. In a follow up blog, we will look at some of the more advanced aspects of business data, including the use of business exclusion events, and linking multiple data tables to further open the possibilities.
To read this blog written by Richard Croney on the Periscopix website, please click here.

Please login to comment.
Comments